Techniques:

Optical Tweezers
Single Particle Tracking
Theory:
Fluorescence Resonance Energy Transfer (FRET) and Quenching
|
Techniques: |
|
|
|
|
|
|
Optical Tweezers |
|
|
Single Particle Tracking |
|
Theory: |
|
|
Fluorescence Resonance Energy Transfer (FRET) and Quenching |
|
Fluorescence Correlation Spectroscopy (FCS)
|
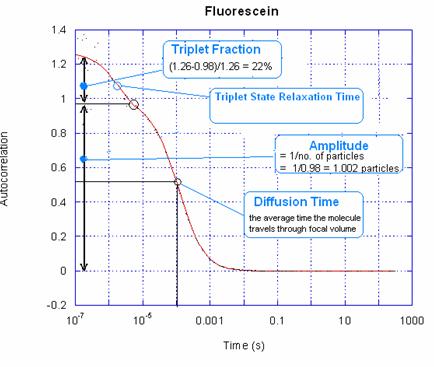
Fluorescence Correlation Spectroscopy (FCS) is a method by which dynamical properties of fluorescent molecules can be studied based on the statistical analysis of the fluctuations of the fluorescence emission. Confocal optics is used to detect the fluorescence emitted from a well-defined (often diffraction limited) detection volume in the sample of interest. Computation of the autocorrelation function of this signal facilitates the recognition of patterns of recurring correlations and provides the researcher with a summary of the average duration time and amplitude of fluctuations associated with the various phenomena that may cause fluorescence changes in the detection volume (e.g. rotation, diffusion, binding or conformational changes). Parameters such as concentration, molecular brightness, diffusion coefficients or reaction rates can then be measured precisely. |
|
Because FCS requires very small (nanomolar) concentrations of fluorescent molecules, and because it is non invasive and non-damaging, it is a technique of choice for the study of molecular dynamics inside living cells. |
|
An autocorrelation function can be used to analyze the measured fluorescence data:
The expression for the autocorrelation function in the case of the simple diffusion of a fluorophore is: 
|
FCS can also detect other dynamical phenomena such as anomalous diffusion, fluorophore blinking, conformational changes and membrane fluctuations.
Books and reviews on FCS:
[2] Rigler, R. and E.S. Elson. Fluorescence Correlation Spectroscopy: Theory and Applications. New York: Springer, 2001.
Examples of Autocorrelation curves
1. Anomalous Diffusion:
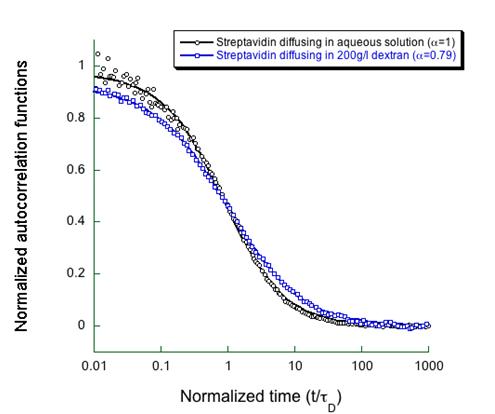
In certain conditions diffusion can become anomalous, and FCS experiments reflect
this change in the nature of the diffusion: the slope of the autocorrelation function
decay is less steep in the case of anomalous diffusion (blue symbols) than in
the case of normal diffusion (black symbols). Figure adapted from Banks et al.,
2004, 60(2), 131-139.
2. Fluorophore Blinking:
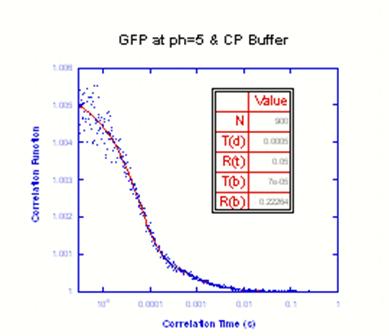
Some fluorophores, like GFP, will emit fluorescence only in the protonated state. The transition between the fluorescent and dark states of the fluorophore is called blinking. This autocorrelation curve shows fluorophore blinking: two decays are clearly visible, one corresponding to diffusion and the other to blinking.